Agile Accelerate

Leave Nothing on the Table


Leave a comment

“Leave Nothing On the Table: Where Your Productivity Goes—And How to Get It Back”

Leveraging Strategy, Metrics, and Agile Practices to Maximize Efficiency

How efficient is your organization?

If you were to estimate how much of your team’s work actually translates into real, tangible outcomes, what would you say—60%? 70%? Most leaders assume that the majority of their team’s efforts drive meaningful results.  

The reality, however, is far more alarming. Studies show that, on average, teams only accomplish 15% of work planned  —the rest disappears into inefficiencies, misalignment, and hidden bottlenecks.  

What if I told you that you could reclaim 10-20% or more of that lost capacity—not by working harder, but by identifying and addressing the key areas where work quietly drains away? By tackling these areas where process inefficiencies hide, organizations can dramatically increase their projected outcomes which means more delivery of services or products that customers can engage with and ultimately more money back to the company.

This white paper explores the seven critical leverage points that allow teams to recover lost work, reduce waste, and maximize productivity. Through a series of assessments and targeted workshops, Agile Accelerate is helping companies across the globe achieve more with existing resources using a targeted approach to find waste and attack it, leaving nothing on the table.

How Did This Happen?

In today’s complex and often isolated business structures, organizations often overestimate the efficiency of their operations. While many leaders believe that a significant portion of their team’s efforts directly contributes to organizational goals, the reality is starkly different. Research indicates that a substantial amount of work is lost due to various inefficiencies. McKinsey

A study by McKinsey & Company highlights that many organizations, despite adopting agile practices, are “ultimately doing so to deliver work and not value.” This misalignment between effort and value delivery underscores a critical issue in modern workplaces. McKinsey

The consequences of such inefficiencies are profound. Organizations face increased costs, delayed project timelines, and diminished employee morale. For instance, a report from the Project Management Institute found that for every $1 billion invested in projects, $122 million was wasted due to poor project performance. PMI.org 

In many cases, engineering efforts are so splintered, that just the efforts to tackle technical debt is hindered by context switching to address code maintenance issues and operational tasks or non-coding issues.

Addressing these challenges presents a significant opportunity. By identifying and mitigating these inefficiencies, organizations can enhance productivity, reduce costs, and improve overall performance. Implementing targeted strategies to tackle these issues can lead to substantial gains in efficiency and value delivery.

In the following sections, we will delve deeper into these inefficiencies, providing data-driven insights and practical solutions to help organizations reclaim lost productivity and achieve their strategic objectives. 

Help!

If only 15% of work is truly delivering value, what happens to the rest? The answer lies in seven key areas—common but often overlooked pitfalls that drain capacity, create inefficiencies, and erode the impact of even the most well-intentioned teams. Understanding these areas is the first step toward reclaiming lost work.

  • Dark Work – Tasks that consume time and resources but aren’t tracked or measured, making them invisible to leadership and impossible to optimize.
  • Low-Value Stories – Work that gets done but contributes little to strategic goals, often due to unclear requirements or poor stakeholder alignment.
  • Overhead – Administrative burdens, excessive meetings, reporting, and other non-value-adding activities that slow execution.
  • Misalignment – When teams and leadership operate with different priorities, causing duplication, conflicting efforts, and wasted resources.
  • DOWNTIME – Delays, handoffs, waiting for approvals, and other process inefficiencies that stretch timelines and reduce output.
  • Poor Prioritization – Teams spread thin across too many initiatives, leading to context switching, burnout, and a lack of meaningful progress.
  • Technical Debt – Short-term fixes and neglected system improvements that create long-term inefficiencies, making future work slower and costlier.

Each of these areas represents a recoverable loss—a place where small, targeted improvements can unlock 10-20% or more of lost capacity. By systematically addressing these issues, organizations can shift from merely working harder to working smarter, ensuring more of their effort translates into meaningful, high-value results.

What’s In It For Me?

At Agile Accelerate, we first work with organizations to assess what is currently being left on the table. A picture of this may be unique for different businesses, but many of the root causes are shared across industries. 

Our company then crafts custom and targeted workshops that directly address the work loss challenges described above, along with their benefits and implications. In the past, we have offered services focused on giving the organization 100% control over the work committed to and delivered. Example workshops we have hosted include:

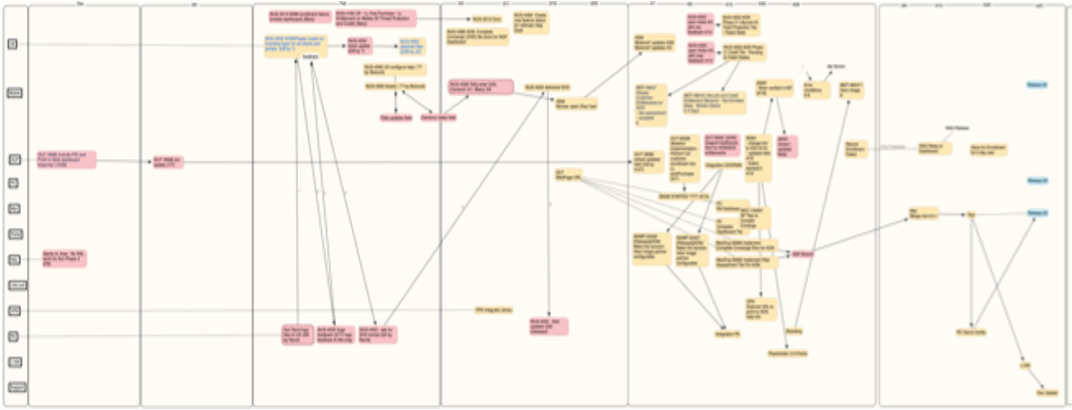
1. Facilitated Strategy Mapping

  • Relevance to Work Loss: Many organizations struggle with inefficiencies because their teams lack clear alignment on objectives, critical success factors, and key activities. This leads to wasted effort on low-impact work.
  • Benefits: This workshop helps teams refine their vision and create structured success factors, ensuring that efforts are focused on delivering actual value rather than just completing tasks.
  • Implications: Companies that engage in strategic mapping can reduce misalignment, minimize duplicated efforts, and significantly improve the impact of their initiatives.

2. Metrics Audit and Strategy

  • Relevance to Work Loss: Organizations often measure activity rather than value, leading to an overemphasis on busy work instead of meaningful outcomes.
  • Benefits: By assessing gaps in current metrics and aligning them with value delivery, this workshop helps teams track progress in a way that drives impact rather than just motion.
  • Implications: Businesses that refine their measurement strategies can better identify inefficiencies, eliminate unnecessary work, and redirect focus toward high-value outcomes.

3. Value Stream Mapping Workshop

  • Relevance to Work Loss: Inefficiencies in workflow, handoffs, and bottlenecks often lead to excessive delays and wasted effort across teams.
  • Benefits: This workshop enables organizations to visualize their end-to-end delivery process, pinpoint waste, and create actionable plans for improvement.
  • Implications: By eliminating bottlenecks and streamlining workflows, organizations can enhance productivity, shorten cycle times, and improve overall efficiency.

4. Facilitated Root Cause Analysis (RCA)

  • Relevance to Work Loss: Many organizations implement surface-level fixes without addressing the systemic issues causing inefficiencies, leading to recurring problems.
  • Benefits: RCA helps teams methodically analyze and identify the true sources of inefficiencies, ensuring solutions are impactful and long-lasting.
  • Implications: Companies that perform root cause analysis can prevent repetitive failures, improve problem-solving capabilities, and reduce wasted time spent on rework.

These workshops provide concrete, actionable ways to tackle inefficiencies and reclaim lost productivity, ensuring that organizations are focusing on meaningful, value-driven work. 

Act Now! 

It’s time to leave nothing on the table and unlock your organization’s Full Potential.

The hidden inefficiencies in your organization—misaligned strategies, untracked metrics, fragmented collaboration, and unoptimized workflows—are costing you valuable time and resources. Agile Accelerate interactive workshops are designed to uncover and address these obstacles, empowering your teams to align on strategy, work smarter, and drive real, measurable impact.

Our sessions provide actionable insights and practical tools that help organizations streamline operations, enhance collaboration, and maximize value delivery. Whether you’re struggling with ineffective planning, lack of alignment, or missed opportunities for growth, our expert facilitators will guide you through targeted solutions that create lasting transformation.

The cost of inefficiency is too high to ignore. Let’s work together to reclaim lost capacity, strengthen your team’s agility, and ensure nothing is left on the table. 

Contact Agile Accelerate today to explore how our workshops can drive immediate and lasting improvements in your organization.

Schedule a consultation now and take the first step toward transformational success!


Leave a comment

Deliver Features to Customers 5 Times Faster

Does it seem to take a long time for your company to get a feature out the door? Have you done a “Five Whys” on the problem? Does one of the root causes seem to be the number of dependencies between teams, or “steps” that it takes to get something out the door? Chances are that it has something to do with the way your teams are structured.

The debate between feature teams and component teams is as old as Scrum is (which is getting to be Keith Richards territory). It usually boils down to:

  • Component teams are more efficient because a small number of SMEs who know the code inside out are the most effective to work on that part of the code. Anyone else interfering in the code will make a mess and create technical debt.

And the discussion about possible restructuring ends there.

It ends because there is also often a hidden reason why leaders don’t want to move to feature teams. If pressed, the following concerns may emerge (if not pressed, they will stay under the radar):

  • “As a leader, I am defined by the component I own, and the team(s) that work on it. I am also a SME in that component, which gives me job security. Moving to a feature team model would be threatening – Would I have a team? Would my people be scattered across multiple teams? How would i have time to attend all of those teams’ meetings? Would i still own a component?” And so on.

We will address these concerns later. But first, let’s look at a real case study…

I was a transformation coach at a large software company that was struggling with exactly this issue. Minor customer requests or enhancements seemed to take forever to deliver. So I worked with a colleague to do a deep dive into the problem. We selected a simple feature enhancement that took twelve weeks to deliver once the work began and inspected every Jira ticket that related to it. The following graphic shows the dependencies between all of the teams that were involved in the solution. It is blurred intentionally of course.

Each swim lane represented a different team – front end, back end, UX, globalization, various components, etc. What was fascinating about this investigation was that the aggregate amount of time expended by all of the teams was six times what a single team could do. Not because any of the teams were inefficient – on the contrary, they worked on their tickets efficiently. But, if it only took a day or two to do their part, it basically sat in the queue waiting for the next team to pick it up. And that was where the end-to-end inefficiency was.

I used the Flow Efficiency metric to get a sense for the level of our problem. Flow Efficiency is defined as Value-added Time/Total Elapsed Time expressed as a percentage. In this case, elapsed time was 6 sprints or 12 weeks (60 working days). The aggregate value-added effort was about 60 staff-days. But this metric is usually calculated on a per team basis, which is a straightforward calculation for a single team. However, when multiple teams are contributing to the Value-added Time, Flow Efficiency would be overstated. One can divide by the number of teams, which in this case would have given us a Flow Efficiency of just 8% or so. But I think that is misleading. So we used a modified metric, which was, effectively, “How long COULD it have taken with a single cross-functional team” versus “How long did it actually take?” With that metric, the Flow Efficiency was 16%.

This data was presented to senior leadership and was considered to be very eye opening. The obvious solution would be to create cross-functional feature teams. Of course, there were concerns:

  • New teams accessing code bases they would be unfamiliar with (of course, this points to deeper issues, like lack of automation and existing technical debt)
  • Loss of ownership of components and people (as mentioned above)
  • Some features might not lend themselves to the approach
  • A general concern about disrupting the organization

To make a long story short, we took an approach that addressed all of the concerns, which consisted of these elements:

  • Start small with a pilot program – we created 6 new teams, which represented only 10% of the org
  • Have a change management process to onboard middle managers and team managers
  • Designate SMEs on the component teams to reserve some bandwidth to help people who are new to the code base with software design decisions
  • Implement a fast-feedback continuous improvement program to quickly address concerns and resolve issues
  • Establish measurable metrics to represent the goals we wants to achieve, along with checks and balances

The metrics chosen were:

  • Flow Efficiency, defined as described above (this is like a lagging KR in OKR parlance to measure the key objective). Because we expected some initial challenges, we also measured how fast the teams ramped up to a steady state level of flow efficiency.
  • Subject Matter Expertise, to measure how quickly new developers got up to speed on unfamiliar components (leading KR)
  • Team satisfaction (balancing KR)

Of course, there were bumps along the way, but by all indicators, the program was very successful and Flow Efficiency was improved by a factor of 5. Across six different initiatives, average flow efficiency for the duration of the pilot was 80%. Even better, the teams ramped up to an average flow efficiency of 89% and this was done fairly quickly – an average of 1.3 sprints, or 2-3 weeks. 

Average team satisfaction increased by 30% over a period of six months, mostly because developers got out of their rut and learned new things. Subject matter expertise improved by 38% on an annualized basis.

Details of the methodology, practices, measurements, and learnings were presented in a white paper called “Winning the Concept to Cash Game with Feature Teams” at the 2021 XP Conference by Martina Ziegenfuss and myself.

Not unlike a stock investment disclaimer, actual results may vary and the variations may be substantial. But if you would like to deliver features to your customers five times faster, there is definitely value in considering an approach such as this.


Leave a comment

Extending Cross-Functionality to Programs

There is an excellent rationale for cross-functional teams.  For large programs, that rationale can be easily scaled to the program-level.  But, for some reason, this isn’t always recognized.

TEAM CROSS-FUNCTIONALITY

Let’s say you have a team with the following profile of highly siloed individuals:

xfunc1

This is great if you have a profile of stories that fits it perfectly, as follows:

xfunc2

But what if your set of sprint stories looks more like this?:

xfunc3

In this case, you have a deficiency of analysts, back-end developers, and QA people to implement the stories that your aggregate team capacity might otherwise support.  And, your UX folks and front-end developers will be twiddling their thumbs for part of the sprint.

So, what to do?

Since you are only as good as your lowest capacity component (which appears to be QA, from this particular example), you will have to scale back the number of stories to fit the profile, as shown:

xfunc4

Now, everyone is underutilized, except for QA.  Good luck finding something useful for everyone else to do in the next two weeks.

The net result is that your team is perhaps 30% less productive than it could be (eyeballing the graphic).

However, if you take advantage of standard cross-functional teamwork, your team’s profile may look something like this:

xfunc5

Note that by “cross-functional” we do not mean that everyone should be able to do anything.  There are very valid reasons (education, experience, proclivity, enthusiasm) why certain people are ideally suited for certain kinds of work.  Think of the cross-functional nature of someone’s role on a team as a bell curve (alternatively, some talk about T-shaped employees – the T is just the bell curve upside down, as the Y-axis orientation is arbitrary).  The more the curve is spread out, the more they are able to take on other people’s roles.  On a good cross-functional team, the bell curves overlap “somewhat,” meaning that everyone can take on a little bit of someone  else’s role, although perhaps not as efficiently.  Still, this allows a team to take on a wide variety of “profiles” of sprint work, as will always be necessary.

So, for example, in the case above,

xfunc6

people will adjust to the desired “sprint needs” profile as follows:

xfunc7

PROGRAM LEVEL CROSS-FUNCTIONALITY

Don’t forget that this model can be applied to more than just teams.

For example, there can be a tendency for teams to develop “specific expertise”, due perhaps to knowledge held by certain BSAs or specific architectural or design skills in the development team.  The program may then tends to assign stories based on this expertise under the theory that this is the most efficient way to get work done. Unfortunately, this has the effect of only further driving each team into a functional silo.  It can become a vicious spiral and soon you may hear things like “well, we don’t have generic teams and, at this point, the schedule is paramount, so we need to keep assigning program work according to the team best suited to do it.”  As a result, program backlogs will consist of stories pre-targeted to specific teams, even arbitrarily far out in time.  Imagine what happens when the stakeholders decide to re-prioritize epics or add new features, or a new dependency arises that doesn’t line up with the ideal team at the right time.  The result will be a work profile that doesn’t match the “team profile,” as follows:

xfunc8

Enter a cadre of fix-it people – project managers, oversight groups, resource managers, program managers – all trying to re-balance the backlog, shuffling stories around, adding people to teams, squeezing some teams to do more work, while other teams tend to be idle, therefore resulting in the assignment of less than necessary filler work.  It is the same wasteful resource management nightmare that is so easily solved by cross-functional teams, except this time at the program level.

So, eliminate the waste, and follow the following simple program level guidelines:

  1. Create a fully prioritized program backlog without consideration for the teams that will be executing the stories.
  2. Once per sprint, have a program planning session or meta-scrum (Uber-PO, Uber-SM, team representatives) where the candidate stories for the upcoming sprint are identified for each team.  Include a little more than each team’s velocity would otherwise indicate in case they are able to take on more than their average.
  3. Make it a goal to avoid specializing teams.

All team “profiles” will be identical and program needs can easily be accommodated.

xfunc9

There may be a little bit of short term inefficiency resulting from having the “slightly less than ideal” team work on particular stories, but the more you do this, the more that inefficiency evaporates.  And the advantages are significant:

  • Holistic view of program backlog allow you to focus on what is important – delivering value
  • No need to engage the expensive swat team of fix-it managers to shuffle around people and project artifacts
  • All team members gain experience and learning, often resulting in greater job satisfaction, and higher performing teams
  • No more single point of failure; no more critical path team
  • Far less chaos and confusion, resulting in more focused individuals
  • Extremely easy to manage – program progress is measured by the simple rate at which all teams work through the stories.  Any gaps in targeted scope versus expected scope is easy to identify.


Leave a comment

A Cure for Parkinson’s

Parkinson’s Law – “Work expands so as to fill the time available for its completion

– Cyril Northcote Parkinson

Your agile team can be following 99% of the principles and practices behind Scrum, XP, and/or Kanban and yet still working at half efficiency, or worse, due to Parkinson’s Law.

There is very little in the prescribed principles and practices that directly address the efficiency of executing tasks, save the concept of eliminating waste, but even that usually centers on eliminating workflow waste, not task or work item waste.

The good news is that while your agile team may have tremendous untapped potential, realizing that potential may be as simple as setting up the right environment for them.

It is a natural human behavior to allow work to fill the time allotted.  We have all done it. The reasons are many and various: Overanalysis, not balancing task elements across the work item, struggling with a blocker without asking for help, procrastination, lack of a desire to work faster, lack of motivation, distractions, not managing interrupts well, multitasking, and so on.

Note that every one of those behaviors can be identified and remedied.  But where to start?

Empowering Agile Teams

The first place to begin to solve the Parkinson’s Law problem is with empowerment.  An unempowered agile team is a team that doesn’t care.  And that is a prescription for a bad case of Parkinson’s.

Here is one recipe for curing Parkinson’s within an agile team.  The order is logical: Start where the answer to the leading question is “yes” and work downward:

  1. Have non-team members (by “non-team members” here, I mean anyone other than the team; it could be any level of management, the client, the business, the PMO, etc.) set an unrealistic goal for the project?  This situation will make people feel that they have no control and that if the project fails, it is someone else to blame.  A solution may be to improve transparency around the release burnup.  Is there a release burnup?  If not, start there.
  • Create a clear burnup from empirical velocity and an agreed-upon backlog and distribute it to all stakeholders.
  • Make sure that the release backlog is reasonably well sized.
  • Make sure that the velocity is based on empirical data, not wishful thinking.
  • Ensure that the burnup accurately reflects the backlog and velocity.
  • Make sure that everyone sees it – client, PMO, business stakeholders, various management levels, other potentially impacted teams.  Obfuscation occurs when different groups use different artifacts to present information, so ensure that they are all using the same artifact.
  1. Are non team-members selecting the stories to be run each sprint?  This can serve to prevent the team from feeling ownership.

Tip: Put the Team in Charge of Their Commitment

  • Stop the practice of external story selection and have the team select only enough stories to get to the point that they feel that they can commit to complete those stories and not one more.
  • Have a discussion around the meaning of “commitment.”  Make sure that this is one of those things that require unanimous team agreement, like a jury.  There are some decisions that can be made by a democratic majority, others that are okay to be made by an oligarchy.  But, commitment to a Sprint plan should be unanimous across the entire team.  Without that unequivocal commitment, unspoken naysay remains unchallenged, that could spoil morale right when you need it.
  • Then, during the planning session, ask for that one-by-one commitment to the sprint.
  1. Is a “chicken” (e.g. project manager who is not part of the team) selecting work for people, assigning tasks, assigning story owners, assigning roles?  How can they possibly know better than each team member how what tasks are needed for each story and how long each will take?
  • Eliminate that practice.  Only when the team selects their own work do they feel ownership of that work.  And it is only when a team feels ownership that they will begin to have the motivation to work at their full potential.
  1. Are story sizes small enough that each person can work on at least two stories per sprint?  Large stories that take most of the sprint to complete can create a Parkinson’s effect.  People get used to the idea that they work on only one story per sprint, and so, consciously or subconsciously, allow each story to expand to fill the sprint.  Sometimes you can have a breakthrough in velocity just by breaking that pattern.
  • Size stories such that at least two or three can be worked on by each person in one sprint.  This gets people used to the feeling of finishing and then pulling something off the backlog mid-sprint.
  • It might be necessary for the ScrumMaster to keep close watch on stories to ensure that they don’t languish uncompleted for days.  Once the pattern is broken, this is usually no longer a gating concern.

OK, great.  The team is fairly empowered at this point and work should be flowing smoothly.  Still, they may not feel full ownership and commitment.  One of the problems is that they team may still be looking to their PO and ScrumMaster as their “leaders,” and consciously or subconsciously feeling that the ultimate accountability for the story or the work item or the task is more with these “leaders” than themselves.

So spread out the “leadership”.

Tip: Spread the Spotlight

  1. Do the ceremonies revolve around the same people?  Is it always the SM or PO that facilitates the planning sessions, retrospectives, and sprint reviews?  Do people talk to the SM during the standup?  Start by broadening the leadership.
  • One method is to have story owners.  Ultimately, it is probably ideal for the entire team to feel fully accountable for all stories, but it can be difficult to get there in one step.  So, an interim step may be to have designated story owners, whose job it is to drive the story to completion.  They should ensure that there aren’t gaps in time between sequential tasks of the story and help resolve impediments pertaining to that story.  This can have the negative consequence of individual team members still not feeling accountable to that story being complete, but at least the feeling of ownership has been somewhat spread out.  Individuals who have been story owners can then spread that feeling of commitment to others on the next stories.
  • Ensure that BSAs, QA, and developers all get the chance to be story owners.
  • Once everyone begins to demonstrate accountability to all stories, the story ownership may be dropped.

And yet still it may seem like some stories and tasks are dragging on longer than they should.

Tip: Use the Buddy System

  1. Do people tend to hand off work to each other via documents?  Do they communicate via email instead of in person?  Lack of collaboration can lead to low transparency silos, which are a breeding ground for Parkinson’s.  It is very easy to hide when no one else interacts with you.
  • Encourage collaboration sessions around story acceptance test writing or reviews, perhaps even kickoff sessions for each story.
  • Make a habit of including everyone involved with a story in ad hoc discussions.
  • Encourage pairing; not necessarily for just development, but any functional area, especially where Parkinson’s might be lurking.  Pairing generally speeds up tasks, and many in the XP world even observe that pairing can even reduce overall net effort on a task.  But even if it doesn’t, the payoff in terms of reducing the Parkinson’s effect will probably offset any net effort increase due to the pairing.

A healthy pattern will be established which should stick.  It is hard to watch your velocity drop and hard to let Parkinson’s set back in to a team, once good collaborative patterns have been established.

Tip: Focus on Focus

  1. Do people tend to complain about interrupts, or that they have too many responsibilities outside of story work?  Perhaps it is time to retrospect on those problems.
  • Solutions may exist in process changes.  For example, rather than have everyone on the team be interrupted by a production support broadcast, have level 3 support designates that periodically rotate through the team.
  • Practice good interrupt management. Does everyone on the team understand the evils of multitasking, both from the standpoint of flow as well as context shifting?  Perhaps some education is needed.  Spend a sprint recording what you are doing once per hour (set an alarm) and aggregate the results.  See anything surprising?
  • As a Scrum Master, check to see if people are burning down tasks on multiple stories at the same time, rather than working a task to completion before moving on to the next one.
  • Question the interrupt requests.
  • Give feedback to habitual interrupters,
  • Recognize that you are not indispensible and don’t need to always be the hero.
  • Turn off distractions if you can, like email popups.
  • Resist the urge to check email.
  • Manage time in blocks.

There are many more time management ideas that you can find via a few specific web searches.

By now, we should be seeing a healthy buzz of collective ownership and collaborative practices, and Parkinson’s Law should be all but eliminated.

Parkinson’s is all about lack of motivation.  Therefore, it can be cured by taking steps to establish a team environment where motivation comes naturally.  Any steps that serve to improve empowerment, teamwork, collaboration, and the feeling of collective ownership will have the greatest effect.


Leave a comment

Agile Myths Busted

Ever run across these guys?  People whose lack of experience or fear of change cause them conjure up all kinds of reasons why agile won’t work for their project?

Let’s bust those myths!

Myth: Agile Doesn’t Work for Projects in the Highly Regulated Medical Environment.  (The reason usually given is that FDA regulations require detailed requirements prior to project approval; hence, waterfall.  However, in reality, you can develop in phases, with small incremental sets of requirements and the FDA requires only enough documentation to demonstrate your process.)

Truth: Abbott Labs overcame medical device regulation and stringent Class 3 certification and developed the m2000 Real-time PCR Diagnostics System, a human blood analysis tool, with four agile teams.  Compared to the prior methodology in use, this project resulted in a less cumbersome process, fewer defects, a reduction in costs of 43%, and a reduction in cycle time of 25%.

(Rasmussen, R., Hughes, T., Jenks, J. R., & Skach, J. (2009). Adopting agile in an FDA regulated environment. Proceedings of the Agile 2009 Conference (Agile 2009), Chicago, Illinois, USA, 151-155)

Myth: Agile Doesn’t Work in Government

Truth: The FBI overcame a CMMI level 3, ISO 9001, government-mandated document-driven waterfall life cycle and developed the Domestic Terrorist Database & Data Warehouse with three agile teams.  Compared to the prior methodology in use, this project resulted in significant improvements in release planning, developer satisfaction, and a focus on the true goal: “to catch bad guys.”

(Babuscio, J. (2009). How the FBI learned to catch bad guys one iteration at a time. Proceedings of the Agile 2009 Conference (Agile 2009), Chicago, Illinois, USA, 96-100.)

For another example, the U.S. Department of Defense developed the Strategic Knowledge Integration Website utilizing three agile teams.  Compared to the prior methodology in use, this project resulted in improved quality, fewer defects, better teamwork, and a 200% productivity increase.

(Fruhling, A., McDonald, P, & Dunbar, C. (2008). A case study: Introducing extreme programming in a U.S. government system development project. Proceedings of the 41st Annual Hawaii International Conference on System Sciences (HICSS 2008), Waikaloa, Big Island, Hawaii,USA, 464-473.))

Myth: Agile Doesn’t Work for Large Products

Myth: Agile Doesn’t Work with Distributed Teams

Truth: Google’s AdWords product busts both of these myths.  With 20 teams and 140 people across 5 different countries, this large agile program was a groundbreaking success at Google and resulted in more predictable releases, higher quality, and an improved ability to accommodate changes, as compared to the prior methodology in use.

(Striebeck, M. (2006). Ssh: We are adding a process. Proceedings of the Agile 2006 Conference (Agile 2006), Minneapolis, Minnesota, USA, 193-201)

Myth: Agile Doesn’t Work in the Regulated Telecom environment

Truth: British Telecom moved their entire IT department to agile, starting with 2000 people from 2004-2007.  This large transformation resulted in an improvement from 10% value stream effectiveness to 55%, created an attitude of delivering real value to the business through IT, and shifted the company’s perception of IT from a service provider to an integral part of the business solutions.

(http://www.agilistapm.com/casestudy-british-telecom/http://scalingsoftwareagility.files.wordpress.com/2008/06/scrumbt-v14.pdf)

Myth: Agile Doesn’t Work for Client-based projects

Myth: Agile Doesn’t Work for Fixed Price projects

Myth: Agile Doesn’t Work well when integrating a Third Party Product

Truth: I coached an agile team at a prominent consulting company through a project with a client who was a well known record label.  They built a new, fully rebranded, eCommerce website using open source CMS and Search engine, and a third party eCommerce provider.  The site included product bundling, integrated music player, and social networking integration.  It was implemented using Scrum/XP with a single team of about 12 people over 5 months.  The result was an award-nominated site that improved conversion rates dramatically, ultimately profitable for and considered a strong success for both the agency and the client.

Myth: Agile Doesn’t Work for Manufacturing Vehicles

Truth: Wikispeed developed a 4 passenger, 100 mpg, street-legal road car in 3 months using modular, off-the-shelf, carbon-fiber body construction, with no capital investment, and no paid employees.  Agile processes were utilized with a single international team.  The project went beyond the prototype phase and cars are available online.

(http://www.solutionsiq.com/the-agile-ceo/bid/51480/Agile-Innovation-or-How-to-Design-and-Build-a-100-MPG-Road-Car-in-3-Months)

What else ya got?

(note: leads for some of these case studies came from David Rico’s presentation on Lean & Agile Project Management for Large Programs & Projects)


Leave a comment

The Math Behind Agile and Automation

Every once in a while, we encounter individuals on our teams who have a healthy dose of skepticism about these new Agile practices they are learning. For those who tend to be scientifically-minded, or need more evidence than just a good story, I have found that it is important to give them real data to look at.

As an example, it is interesting to combine the usual Cost per Defect curve for a software project with a histogram that maps the probability or frequency of finding defects to the corresponding project phase. The result is mathematical support for both Agile as well as the value of Automation and good Agile QA practices.

Figure A below shows the typical Cost curve for a waterfall project (source: The Economics of Testing, Rice Consulting) along with an overlay showing the probability of finding defects in various phases of the project.

Cost of Fix per Defect - Waterfall

As can be seen, most defects are found during the testing phase, as one might expect. Using some industry standard numbers, the cost to fix per defect is about $490.

Note, however, what would happen if you are able to find defects earlier in the process.

Cost of Fix per Defect - Modified Waterfall

Figure B shows the same cost curve, but the histogram representing the probability of defects found is pushed earlier in the process. The kinds of practices that might result in such a change include collaborative QA and developer testing, pairing, and automation (which helps prevent the defects from being found in the expensive tail of the curve). This doesn’t mean spending more on QA, just utilizing tighter feedback loops that help prevent defects from getting to the later phase of the project. So, even with a waterfall process, or a non-agile iterative process, one can easily see how collaborative testing and automation can reduce the cost of defects considerably, in this case down to $220 per defect.

The Agile cost curve is actually a little different, as shown in Figure C.

Cost of Fix per Defect - Agile, automated

There is still the hockey stick effect when the software goes into production, but the rest of the cost curve would be flat, since the cost of fixing is pretty much the same from iteration to iteration. The defect frequency histogram is drastically different and is flattened and spread out across the entire life cycle of the release.

In this model, Agile practices alone, such as sprint-based functional testing and having QA and developers working off of the same requirements, are responsible for about a factor of two improvement in overall cost of defect fixing per release. Automation and good collaborative practices are responsible for another factor of two, which gets the overall cost per defect down to about $130.